IG Blade provides a fast, easy and effective way to analyze your Instagram not only your Instagram but also your TikTok, through some simple steps you can make an account in the blade.
igblade.com is a free Instagram analytics tool, where you can check your daily Instagram follower growth, future predictions for Instagram growth, and engagement for your posts and page. thousand of people now using IgBlade just because of its simplicity, igbladigBladee is not only for personal use but also for business there are lot of agency who trusted in IgBlade, its have free version and premium version, a free version is enough for our personal uses, But premium help you a lot to improve your quality in posting, reporting, mentioning, etc
Instagram is social media, photo, and video-sharing social networking service created by Kevin Systrom and Mike Krieger. At date of April 2012. The app allows users to upload photos and videos that can be edited with Instagram edits or we can say filter and organize by hashtags and location. Posts can be shared publicly or with followers which are approved by our request. people can browse other people's content by tags and locations and view trending content. People can like photos and follow other people to add their content to a personal feed.
Tiktok
TikTok, known in China as Douyin, is a video-sharing social networking service owned by a Chinese company. The social media platform is used to make a variety of short-form videos, from genres like dance, comedy, and education, that have a duration from 15 seconds to one minute.TikTok is an international version of Douyin, which was originally released in the Chinese market in September 2016. Later, TikTok was launched in 2017 for iOS and Android in most markets outside of mainland China; however, it only became available worldwide after merging with another Chinese social media service, Musical.ly, on 2 August 2018.
Let's check out how it is going to work, but for that, first, we need to go to the site of IgBlade https://igblade.com/
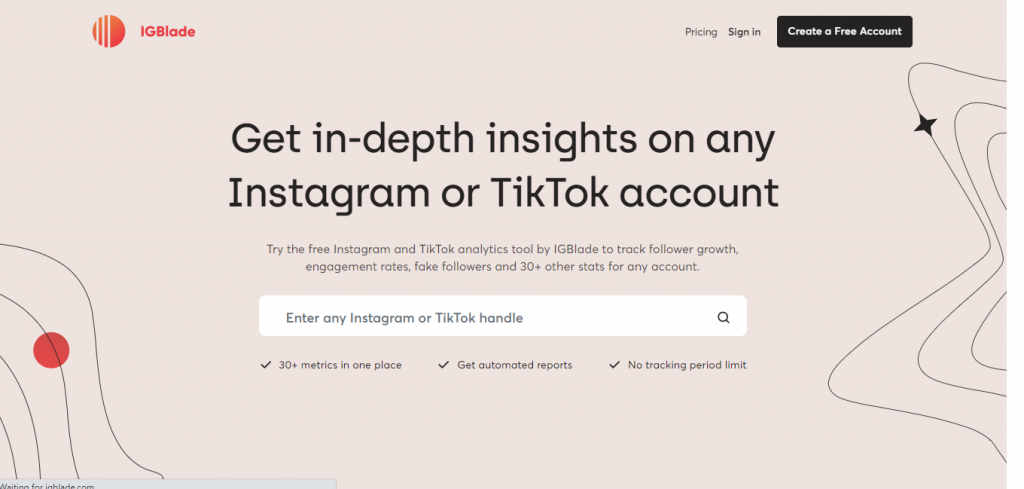
First, we have to make an account, for that click on “ create a free account” and then another tab will open for creating an account in IgBlade
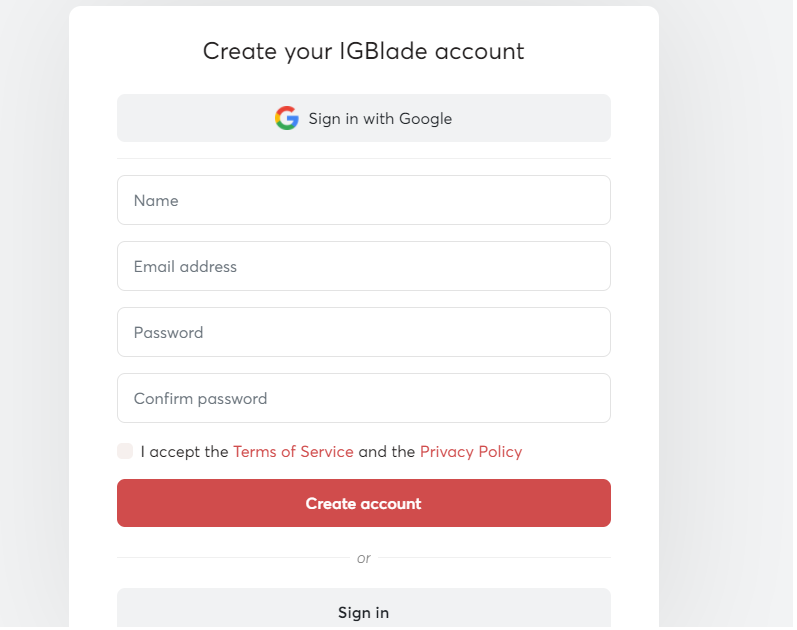
Here you will create an account by entering your name, email address, and password, it's just simple as that or you can sign in with a google account. Here, you have two weeks of trials for knowing IgBlade briefly, after that you can select a plan with comfortable payment
Let’s Check Out IgBlade through an example
Igblade interface is designed in such a beautiful way, with that searching box we can search any page in Instagram or TikTok, but for more options and fun you need to log in,
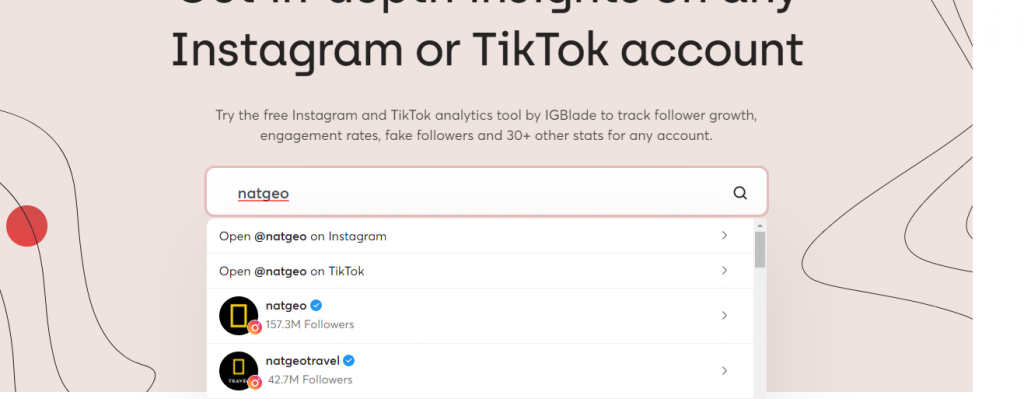
Here is the cool thing. so as I type the name the account has come up. we can select which page we are looking for,
Here NatGeo is an example for our further explanation
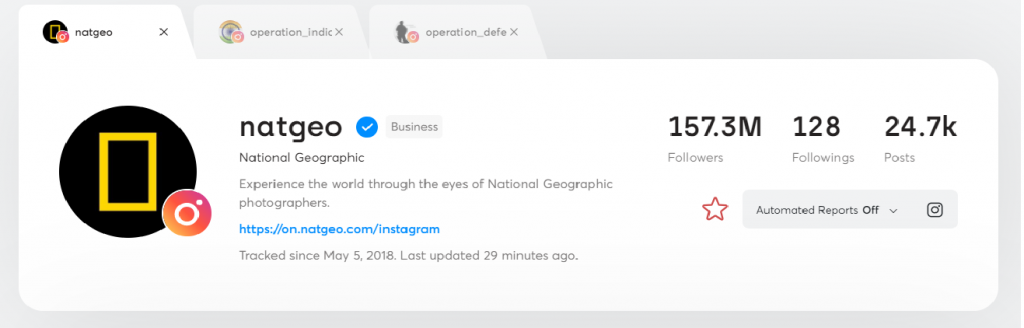
Now you see this is the page we searched. Here we can see all details about that page let's check it out,
This page is verified by the official Instagram team, they have 157.3 million followers not only that but also they post 24700 posts on their pages, NatGeo following 128 people and we can also open the links where we find in their bios.
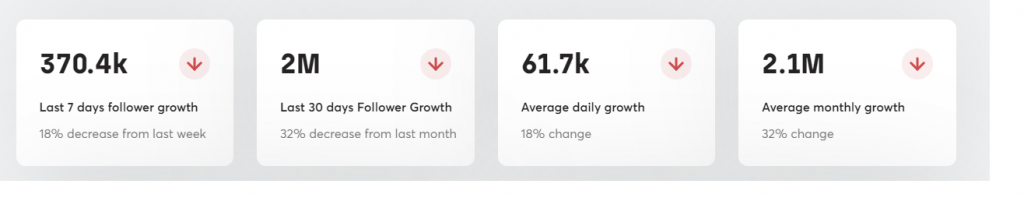
Here, there are four columns which are last 7 days follower growth, last 30 days followers growth, average daily growth, and average monthly growth, with we can simply understand the growth of followers in week and month not only that but also in we can get average of daily and an average of monthly
Here 370.4k followers gained in the last seven days, this page gets 2 million from the last 30 days. So Average daily Growth is 61.7K followers daily and the average monthly growth is 2.1 million followers
Followers And Following Graph
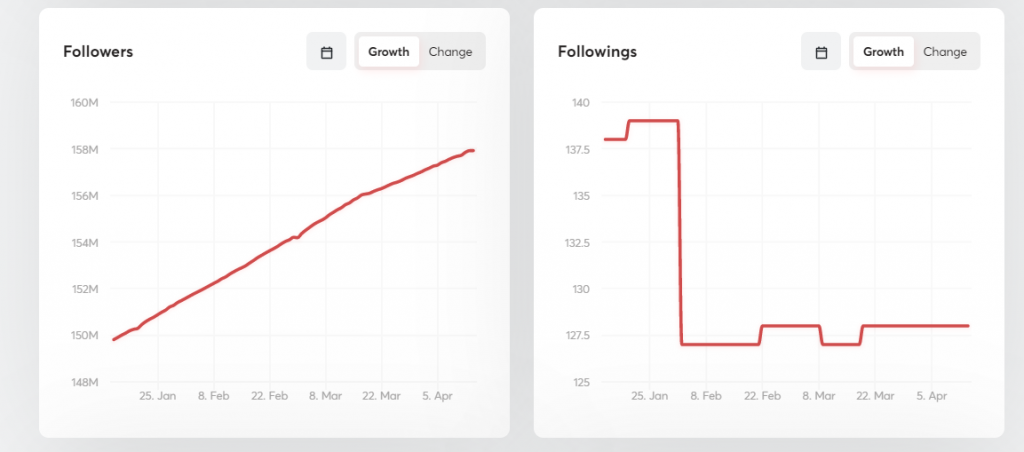
From this graph, we can understand followers growth and how many people are we following, here the graph is exponentially growing with time and date and the next graph of the following is a straight line not only that sometimes it’s up and down
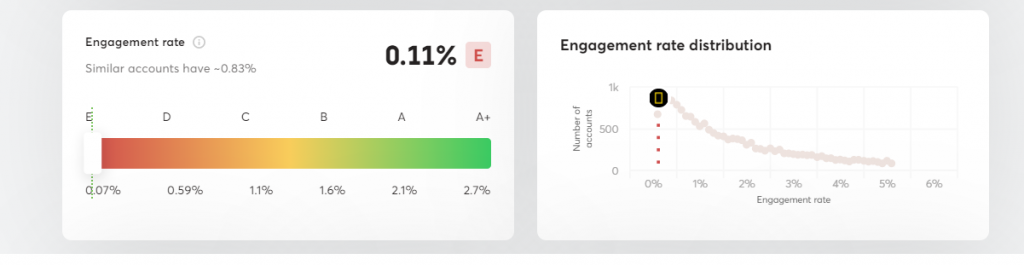
This is an engagement rating graph, here we can understand The average rate of followers who engaged with the page`s posts in the last 180 days. This is one of the wonderful things in IgBlade not only that but also they divide the engagement graph into five sections.
A+ is the highest rank in that graph 8.7 percentage and above, E is the lowest grade below 1.7 percentage, A is the second grade which is 2.1 percentage after its B id the third grade which is 1.6 percentage and fourth grade is C which is 1.1 percentage and fifth grade is d with 0.59 percentage.
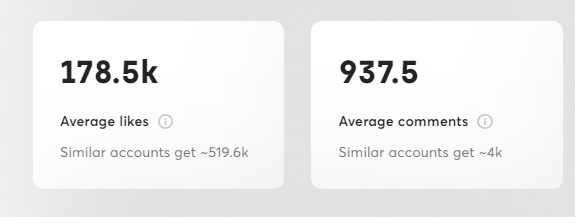
Average likes and average comments, this page got 178.8 k average likes and similar accounts approximately get 519.6k likes and 937.5 average comments not only that similar page gets approximately 4000 comments
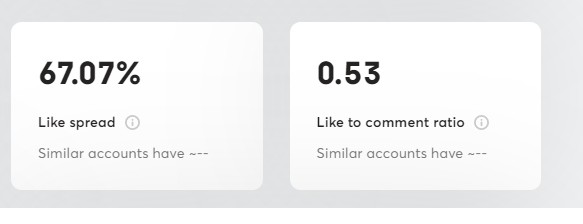
The average spread of the number of likes on @natgeo’s posts. Normally, some posts perform better than others. A low spread might indicate automatic fake likes, its 67.07 percentage.
Accounts using inauthentic engagement tend to have disproportionately more likes than comments. A low ratio may indicate inauthentic likes on posts.
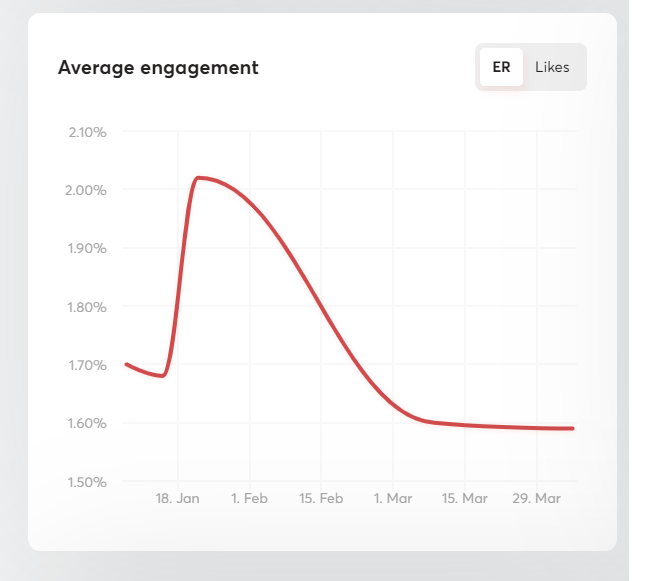
From this graph, we can get the average engagement of the pages. Percentage of engagement in the y-axis and x-axis it’s days, from this graph we can understand that January 20 is the high engagement rate, and from march first, the line is going straight
Followers diagram
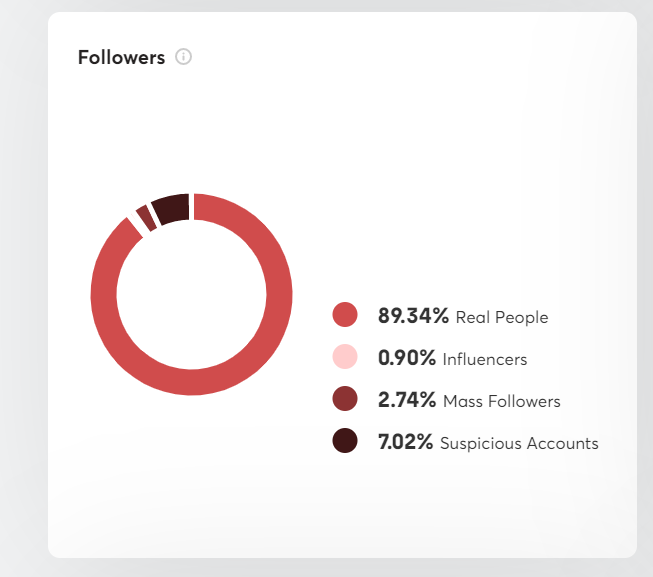
We know that diagrams are very useful to understand pieces of information. From this diagram, we can understand what types of followers mainly follow us. Igblade divided followers into four main groups: real people, influencers, mass followers, and suspicious accounts .
Real people: real people is nothing but the people who are real in Instagram they are not a bot or fake accounts
Influencers: influencers are people who have more than ten thousand followers.
Mass Followers: Mass followers are profiles that follow over 1,500 users on Instagram. They track too much content to see and react to all publications from the profiles they follow.
Suspicious Account: Suspicious accounts include bots accounts, new device logins .
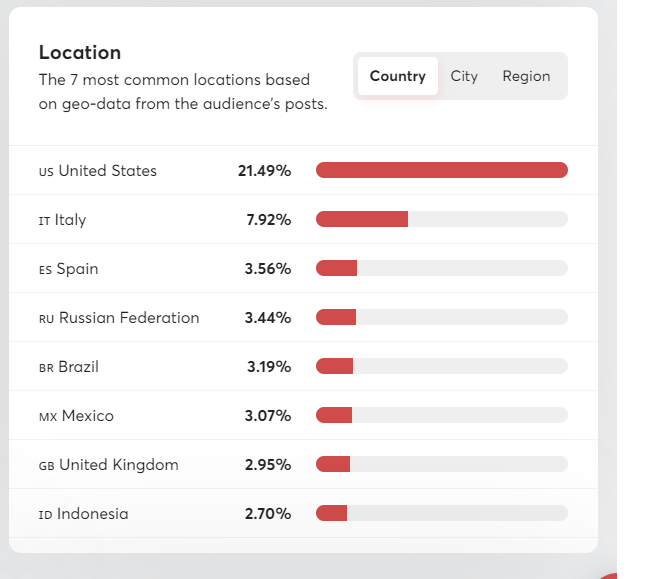
Location graphs
The seven most common locations are based on geo-data from the audience’s posts. from this, we can understand most audiences from the united states of America its 21.49 percentage not last but least from Indonesia audience is 2.70 percentage, Italy have7.92 percentage, Spain have 3.56 percentage, Russia federation have 3.44 percentage, Brazil have 3.19%, Mexico have 3.07pecentage, united kingdom have 2.95pecentage and Indonesia have 2.07 percentage And it also divided into three cities, country, and region.
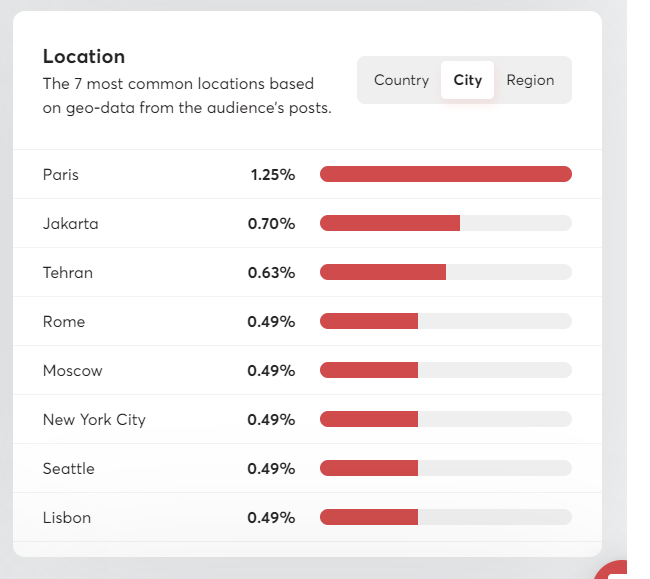
From this graph, we can understand the main city where our followers are from, as I thought Paris have more followers based on city it have 1.25 percentage, Jakarta is the next city which has second-most followers it's 0.70 percentage, the third city is Tehran which has 0.63 percentage, Rome has 0.49 percentage, Moscow, New York, Seattle, and Lisbon also have the same percentage such as 0.49 percentage
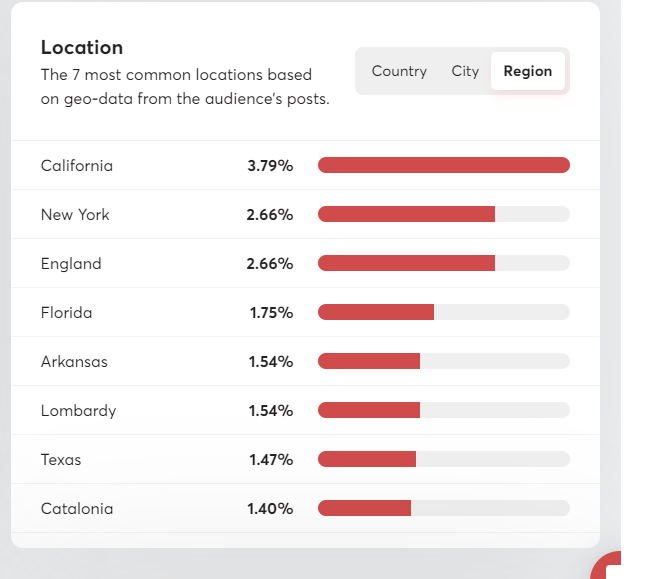
If we looking through regions California is first in place with 3.79% and second is new york city which has 2.66 percentage, from England, there are 2.66 percentage of followers, Florida have 1.75 percentage, Arkansas and Lombardy have the same percentage which is 1.5 percentage and taxes have 1.47 percentage finally Catalonia have 1.40 percentage
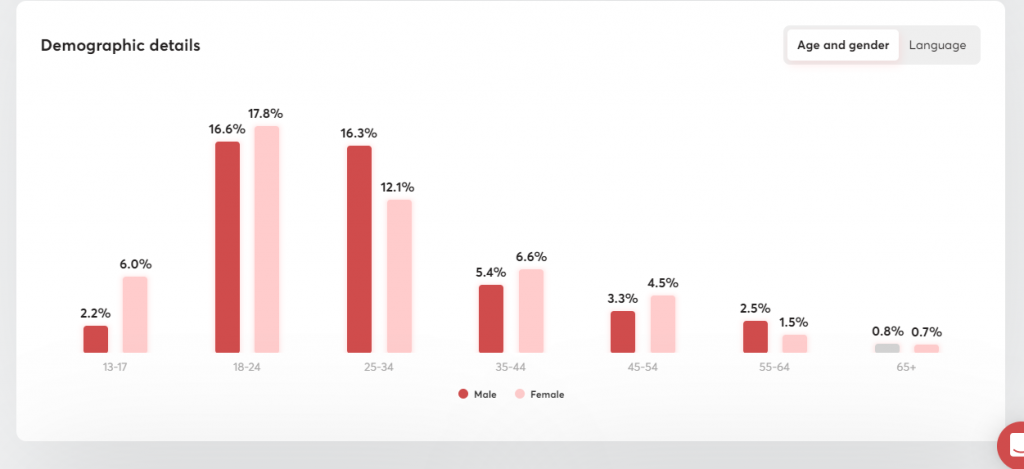
Graph of the age and gender, here clearly we can understand the percentage of women who follow this page not only that but for men and the age of the followers. the age between 18-24 are most followers and 16.6 percentage of male and 17.8 percentage of female and second most followers from 25 to 34 age, And here male is more than women, the male has 16.3 percentage and 12.1 percentage for women, from the ages of 35-44 female is more than male, Female has 6.6 percentage and 5.4 percentage for male. From ages of 55 to 64 males are high in percentage and its 2.5 percentage and women are 1.5 percentage. From 65 ages almost male and female are equal in percentage.
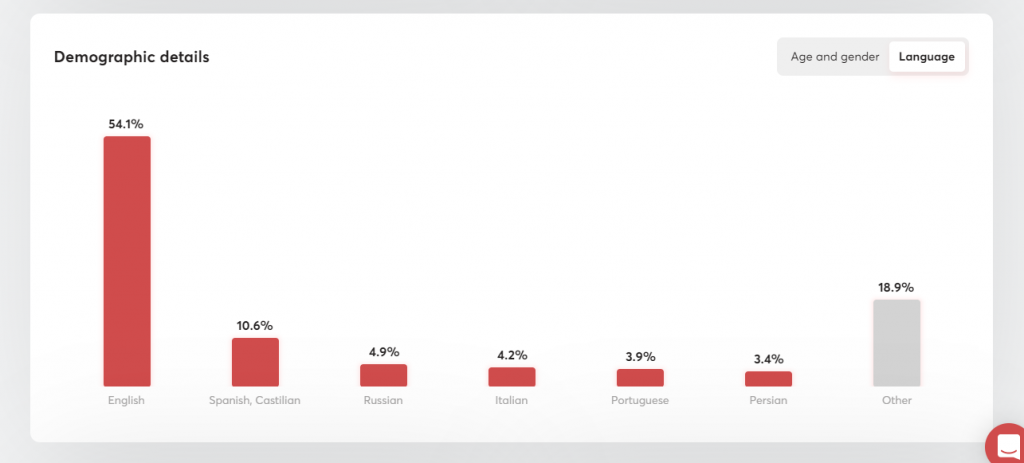
For this graph, we can understand the languages mostly used by our followers, as you see English is the most used language and its 54.1 percentage and second-most language used by followers is Spanish and its 10.4 percentage and third-most used language by followers is Russian, it's 4.9 percentage and Italian language is fourth and Portuguese is the fifth most used language by followers and percentage is 3.9 percentage and Persian is the sixth language used by followers its have 3.4 percentage.
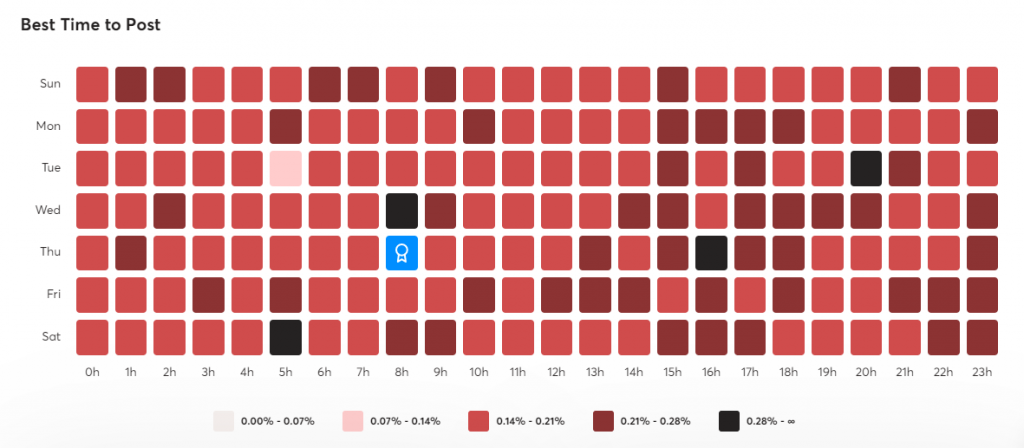
The best time to post on our pages is divided into 5 colors, the y-axis is equal to weeks and x-axis equal to hours, Percentages of engagement, Here White color represented as 0.00 percentage to 0.07 percentage and Baby pink color represented as 0.07pecentage to 0.14 percentage and Red represented as 0.14 percentage to .21pecentage Brown represented as 0.21pecentage to 0.28pecentage and Black represented as 0.28 percentage
IgBlade has a lot of specialties.
There is a simple option in IgBlade which help to add a favorite page to it
We can open pages like as tabs in google chromes
Prediction Growth for next 30 days and Prediction Growth for next 6 months
As you have seen IgBlade is one of the simplest sites which is used to analyze the social media platforms like Instagram and TikTok. IgBlade is not only for personal use but also for business use.